Sounding Atlas Source

Version 1.0, live

Sounding Atlas

A fishing almanac for every lake, river and pond near McMurray, PA and East Canton, OH: where to go, what to tie on, and whether it's safe to eat.

Free to open. Works on a phone, and the whole thing is a single file.

Plate 1. Drag the rose, the board re-ranks, open a water

Sheet 1 / Where to go

Rank the water by what matters today

The atlas covers 21 public waters: reservoirs, park lakes, creeks and rivers within reach of three starting towns: Malvern and East Canton in Ohio, McMurray in Pennsylvania. Pick a starting town, a species or a preset, or drag the five-point rose yourself, and the whole board re-ranks.

The five weights are kid catch rate, trophy potential, variety, convenience and evidence. Three of them are the author's judgment, and the sheet underlines them so they never pass for survey data.

  • Kid day
  • Trophy hunt
  • Quick trip
  • Show the data
  • Balanced
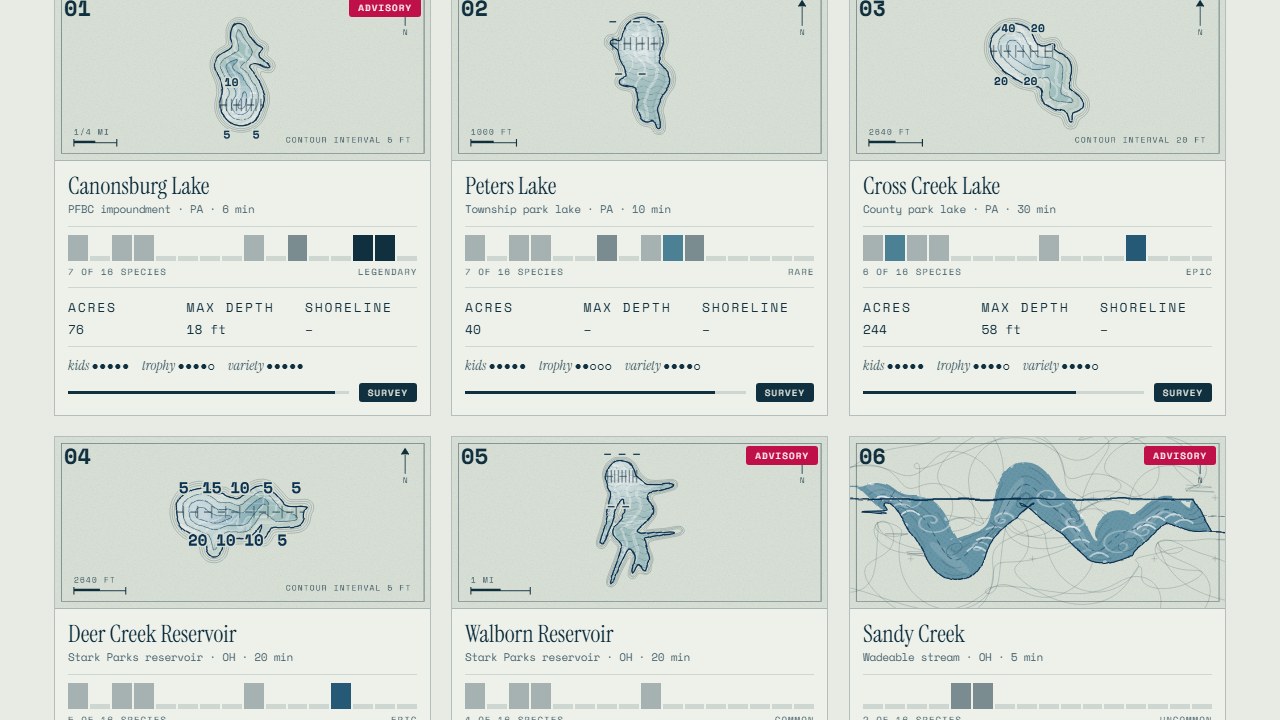
Plate 2. Presets and towns re-rank all 21 waters

Sheet 1 / The plates

Every water drawn from its own numbers

Each lake is a survey-chart plate generated from its real acreage, depth and shoreline, seeded from its name, so a 1,500-acre reservoir and a 76-acre impoundment never look alike. Open one and you get the species on record, the agency survey behind them, the stocking dates, and its consumption advisory first, in red.

A figure is either sourced or it is a dash. An unsurveyed depth is never a zero and never a guess.

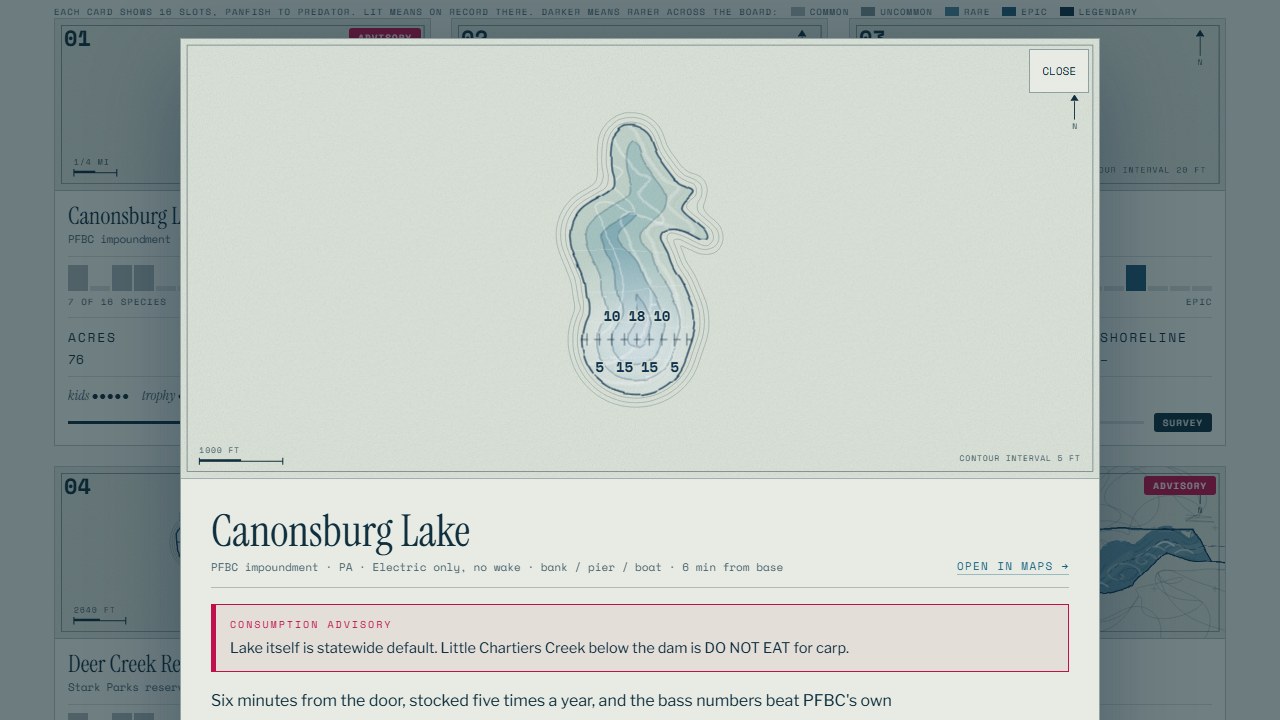
Canonsburg Lake's sheet: a contour plate of the lake, then a red consumption advisory about carp below the dam, then its acreage, depth and agency survey.
Plate 3. One water's sheet, advisory on top

Sheet 3 / What to tie on

Pick a water, get the trip sheet

Choose a water and the atlas writes the day: which licence you need, what to tie on, the hook size, the bait, the rod, the 2026 stocking dates, how far it is from your starting town, and what to know before you keep a fish.

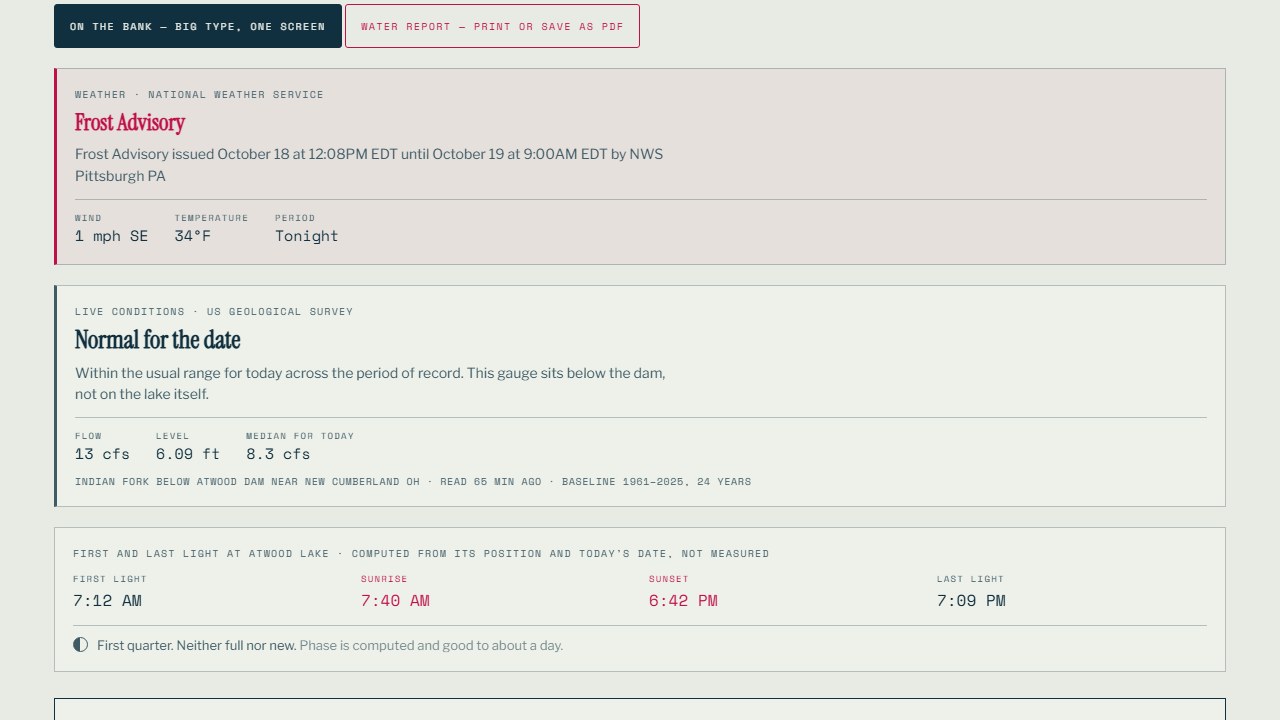
Beside it sit the National Weather Service forecast and, for the eight waters that have a USGS gauge, today's flow judged against that gauge's own record. Technique advice is drawn in outline and labelled as editorial, so it never passes for a measurement.

Plate 4. The trip sheet for one water

Fish safety

Do not eat.

Whether it's safe to eat, said plainly

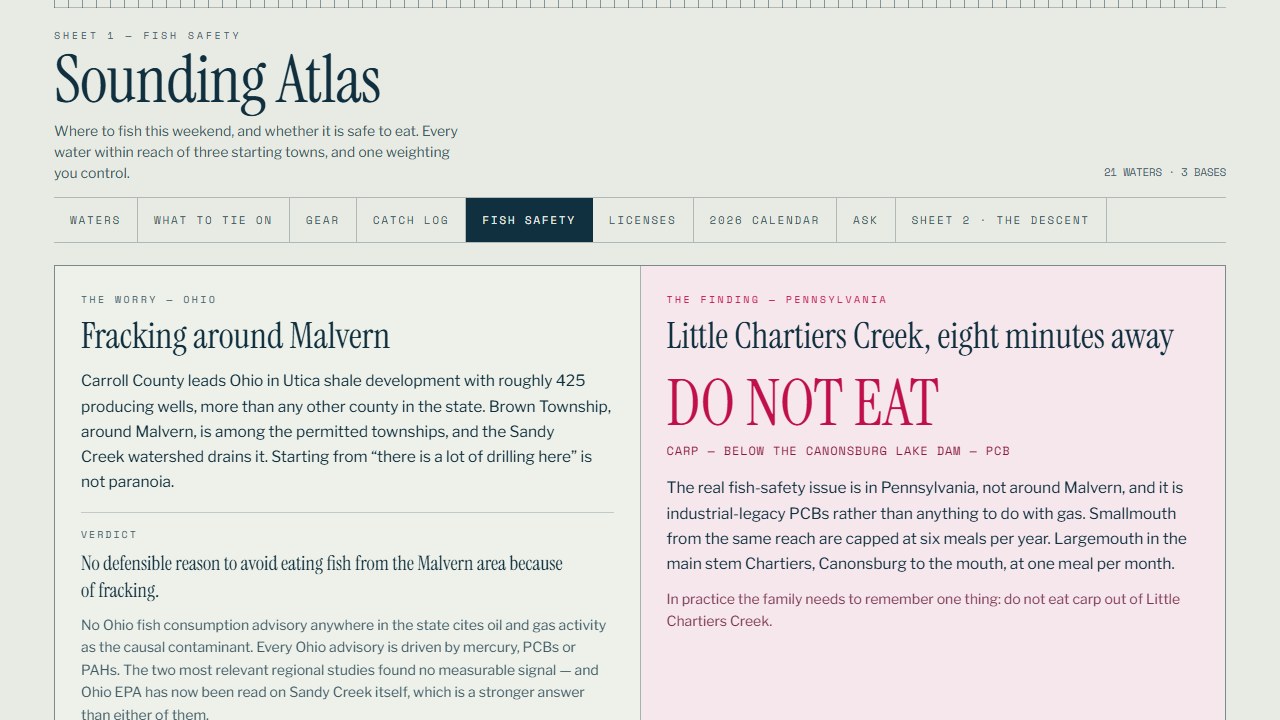
Of the 21 waters, 11 carry a consumption advisory from the state agencies in Ohio or Pennsylvania. The atlas puts each one on the water's card and its sheet, and gives the one rule a family has to remember: do not eat carp out of Little Chartiers Creek.

The advisories are quoted from the agencies and cited, not paraphrased into something softer. Check the agency's current advisory before you keep a fish.

The Fish safety tab: a plain verdict about eating fish near Malvern on the left, and on the right a large red DO NOT EAT for carp below the Canonsburg Lake dam.
Plate 5. Fish safety, with the verdict first

Sheet 2 / The Descent

The same data, read as a water column

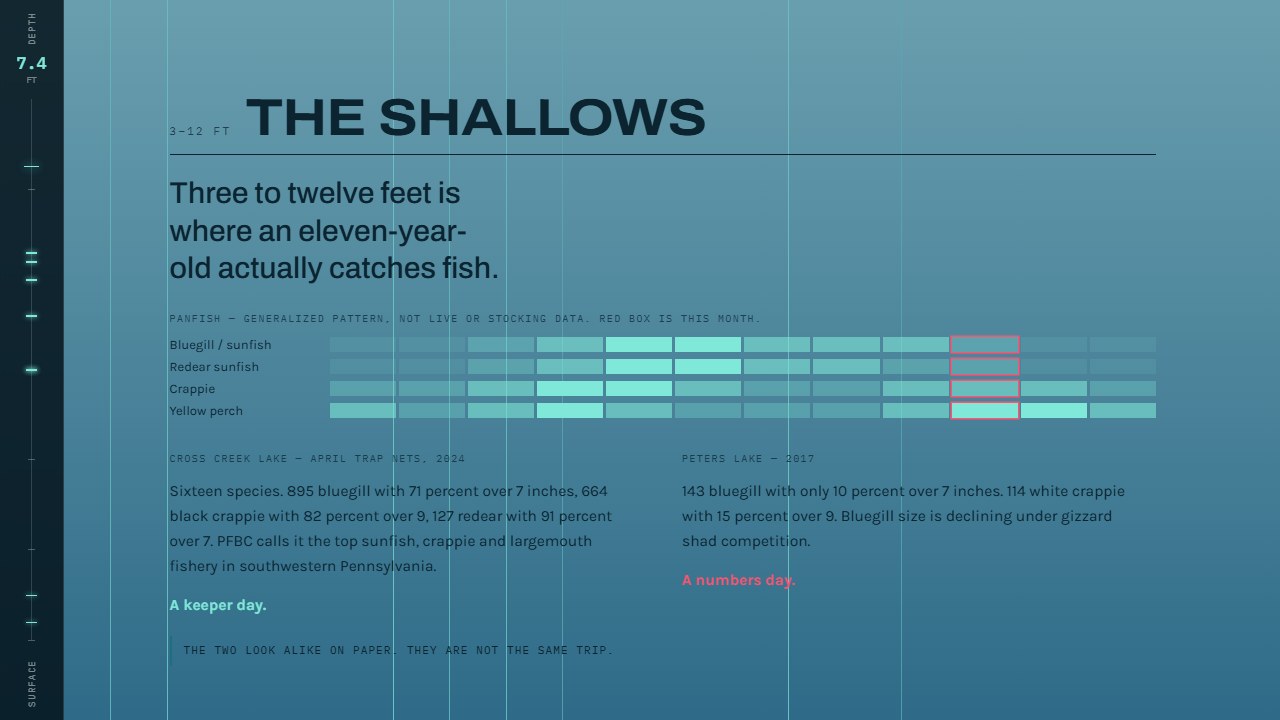
Sheet 2 turns the board into a dive. A depth gauge runs down the side as you scroll, from the margin where a bobber and a bank are enough, through the shallows where an eleven-year-old actually catches fish, down to the thermocline where the water is cold and the fish are beyond a bobber.

It is the same sourced dataset in another typeface and another light, so you can read it as a table or as a place.

Plate 6. The Descent, scrolling down the column

Colophon

How it was made

Stewart Gregerson made it for fishing with his son Liam, and shared it for anyone who fishes the same water. It was written with Claude Code, a second model audited it cold, and it has 125 commits since the first one on 15 August 2026.

One file

The atlas is a single index.html: plain HTML, CSS and JavaScript, no framework, no build step, no bundler. The dataset and the fonts are inlined, so opened from a file path it makes no network request at all, and works in a valley with no signal. Served from its URL it calls only USGS and the National Weather Service, for the live readings.

Plates that never change

Each chart is a drowned-valley basin generated from the water's acreage, depth, shoreline and form, seeded from its name, so a reload is pixel-identical. The species and bait plates are raster images made with the Gemini image API.

Research, written down

Four rounds of reading agency sources, each recorded with what it got wrong, plus a standing-risks file for what could still be wrong. One entry: a USGS request for four statistics came back successful with one column silently empty, and the top safety verdict could not fire for two rounds until the request asked for everything the service publishes.

Checks that had to fail first

Five suites run on every push: the page in real Chromium, a tie-out audit of more than two thousand checks that re-derives every displayed figure from the dataset, the live layer replayed against captured USGS and NWS payloads, the optional assistant worker, and the file's promises about itself. A check is accepted only after it has been shown to fail on a deliberate mutation of what it guards.

Credits and data sources

Every figure on the sheet names its source on the sheet.

WhatWhoLicence or terms
Live streamflow, the daily statistics it is judged against, hydrography outlinesU.S. Geological SurveyU.S. federal government work, public domain
Forecasts and alertsNational Weather ServiceU.S. federal government work, public domain
Address geocoding for park entrancesU.S. Census Bureau GeocoderU.S. federal government work, public domain
Ohio fish consumption advisories, Sandy Creek and Tuscarawas River studiesOhio EPAPublic records of the State of Ohio, quoted and cited
Ohio lake maps, property pages, fishing regulationsODNR Division of WildlifePublic records of the State of Ohio, quoted and cited
Pennsylvania stocking schedules, biologist reports, licence feesPennsylvania Fish and Boat CommissionPublic records of the Commonwealth, quoted and cited
Pennsylvania fish consumption advisoriesPA DEP, PFBC and PA Department of HealthPublic records of the Commonwealth, quoted and cited
Water-quality studiesUniversity of Cincinnati (Botner et al. 2018), USGS SIR 2024-5045, Penn State (Pankratz and Warner 2024)Cited for their findings; read the originals
Rod, reel and tackle-box specsPflueger and Flambeau product pagesManufacturer facts, cited
Species and bait platesGenerated with the Gemini image APIMIT (this repo)
Fonts on this page and in the atlas: Instrument Serif, Libre Franklin, Space Mono (the atlas also uses IBM Plex Mono, Karla and Archivo)Their designers, via Google FontsSIL Open Font License 1.1